Note: This report focuses on cap rates and market trends for the Greater Vancouver area. The Chilliwack commercial real estate market tends to follow similar trends due to regional economic influences, investor activity, and tenant demand. While specific local variations exist, the insights provided here are generally applicable to Chilliwack as well.
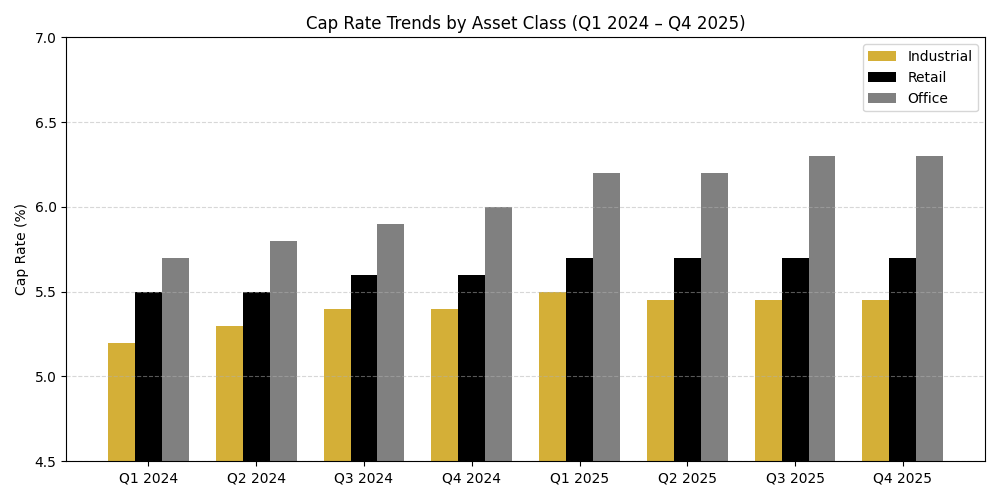
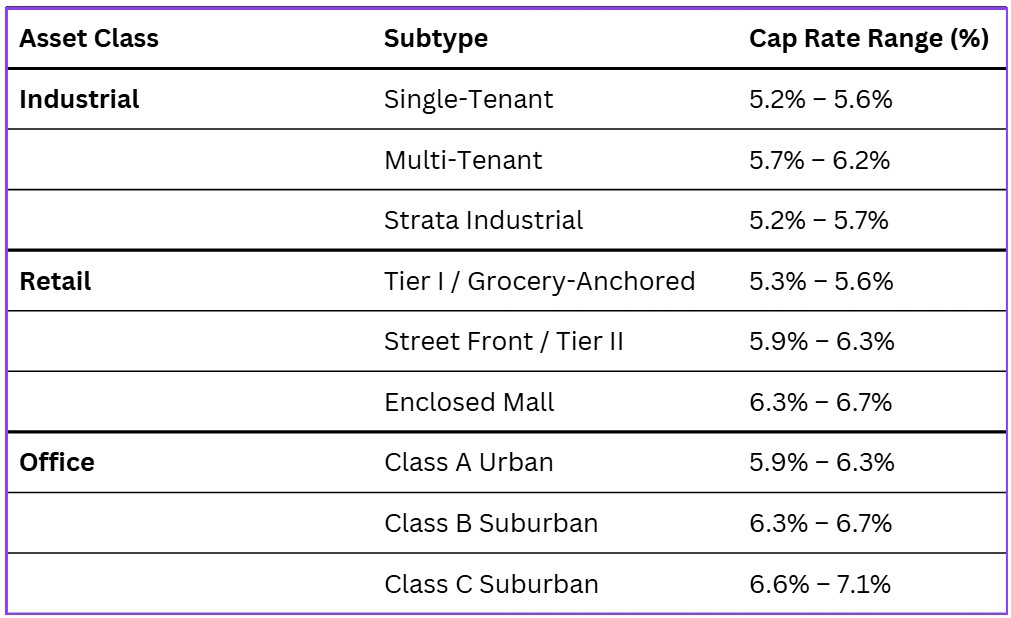
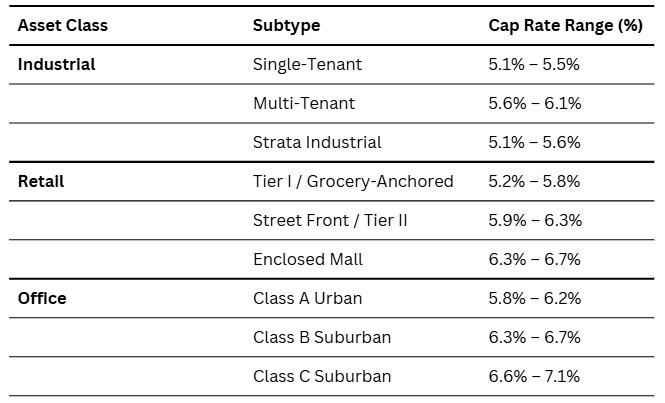
Industrial, Retail, and Office Breakdown
Q1 2026 Cap Rate Snapshot:
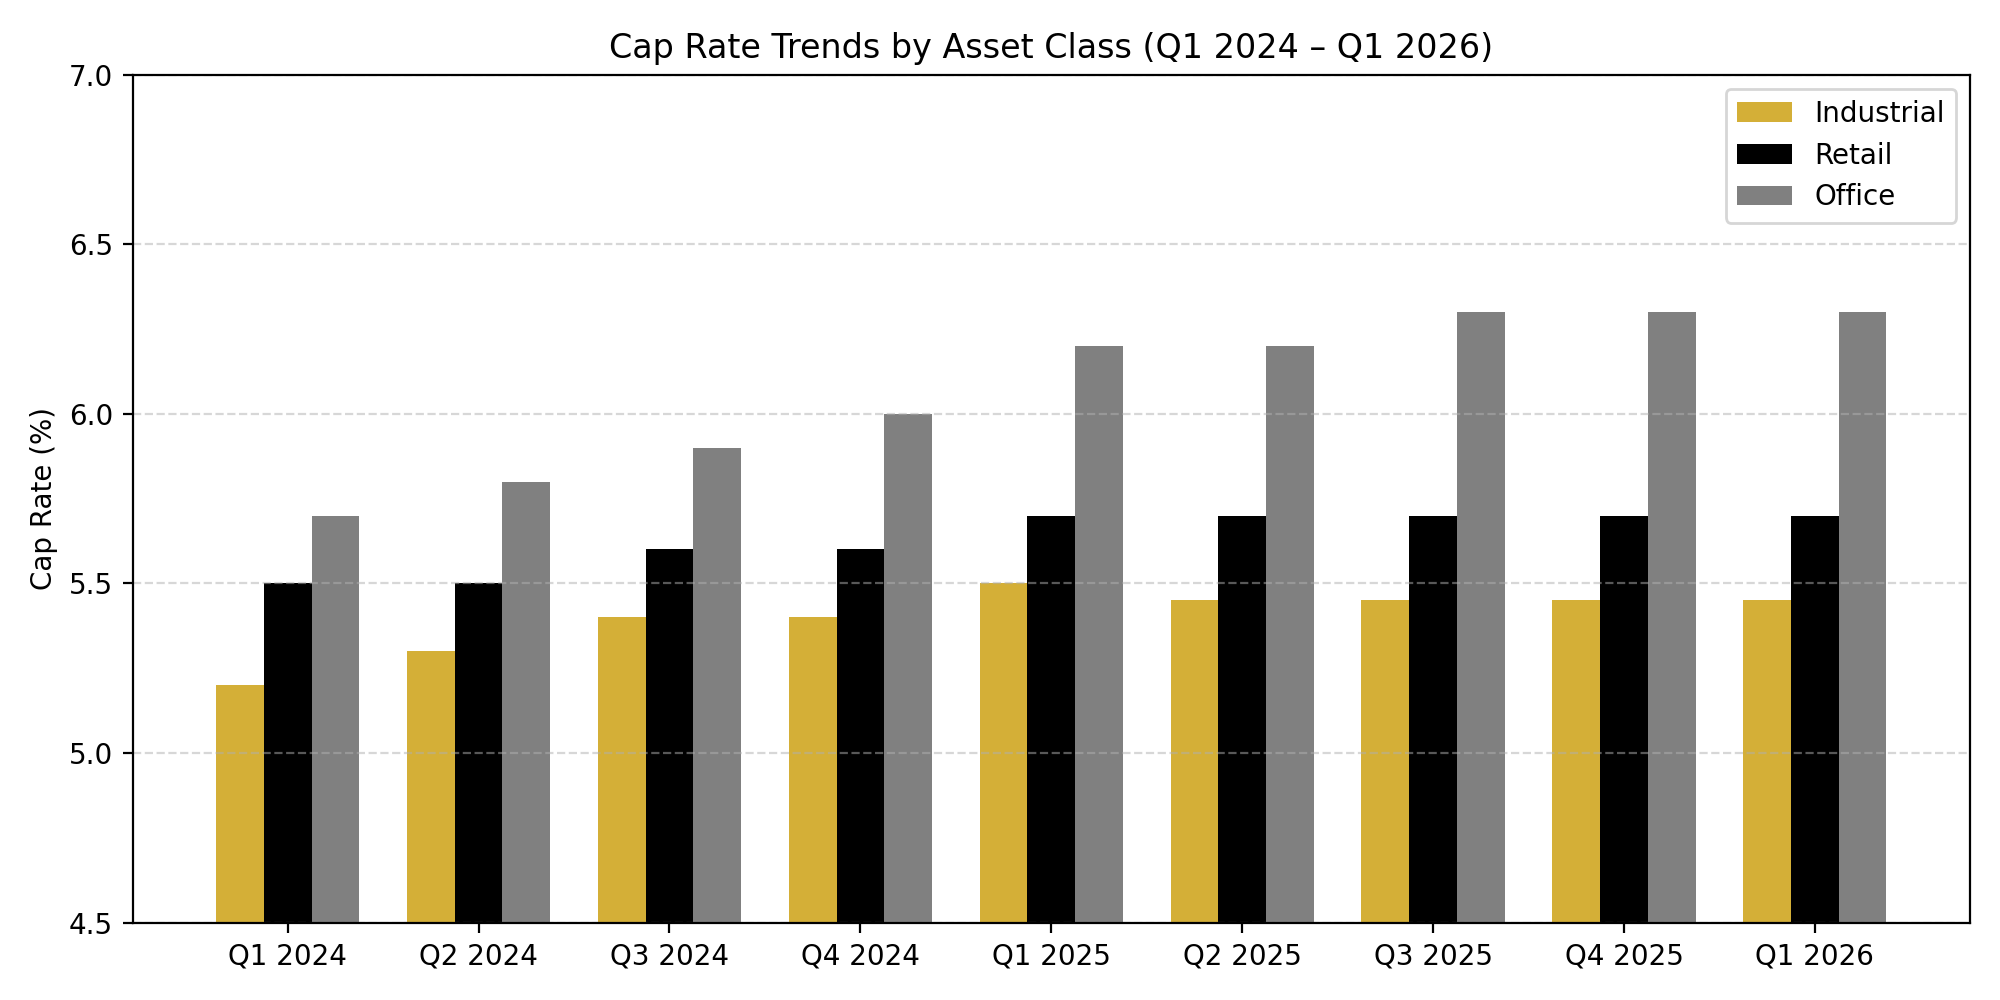
Cap rates across most asset classes remained relatively stable through Q1 2026, with some early signs of tightening in select sectors. The market continues to adjust following the rapid increases seen over the past two years, with pricing now largely supported by more stable financing conditions and improving investor confidence.
Industrial assets remain the most stable, supported by long-term fundamentals, though tenant-favorable conditions are emerging due to increased supply. Retail continues to show resilience, particularly in necessity-based formats, while office properties are showing early signs of stabilization after a prolonged period of pressure.
Overall, the market is transitioning from correction to stabilization. Investors are becoming more active again, but remain disciplined, with a continued focus on asset quality, lease strength, and long-term income durability.
Industrial
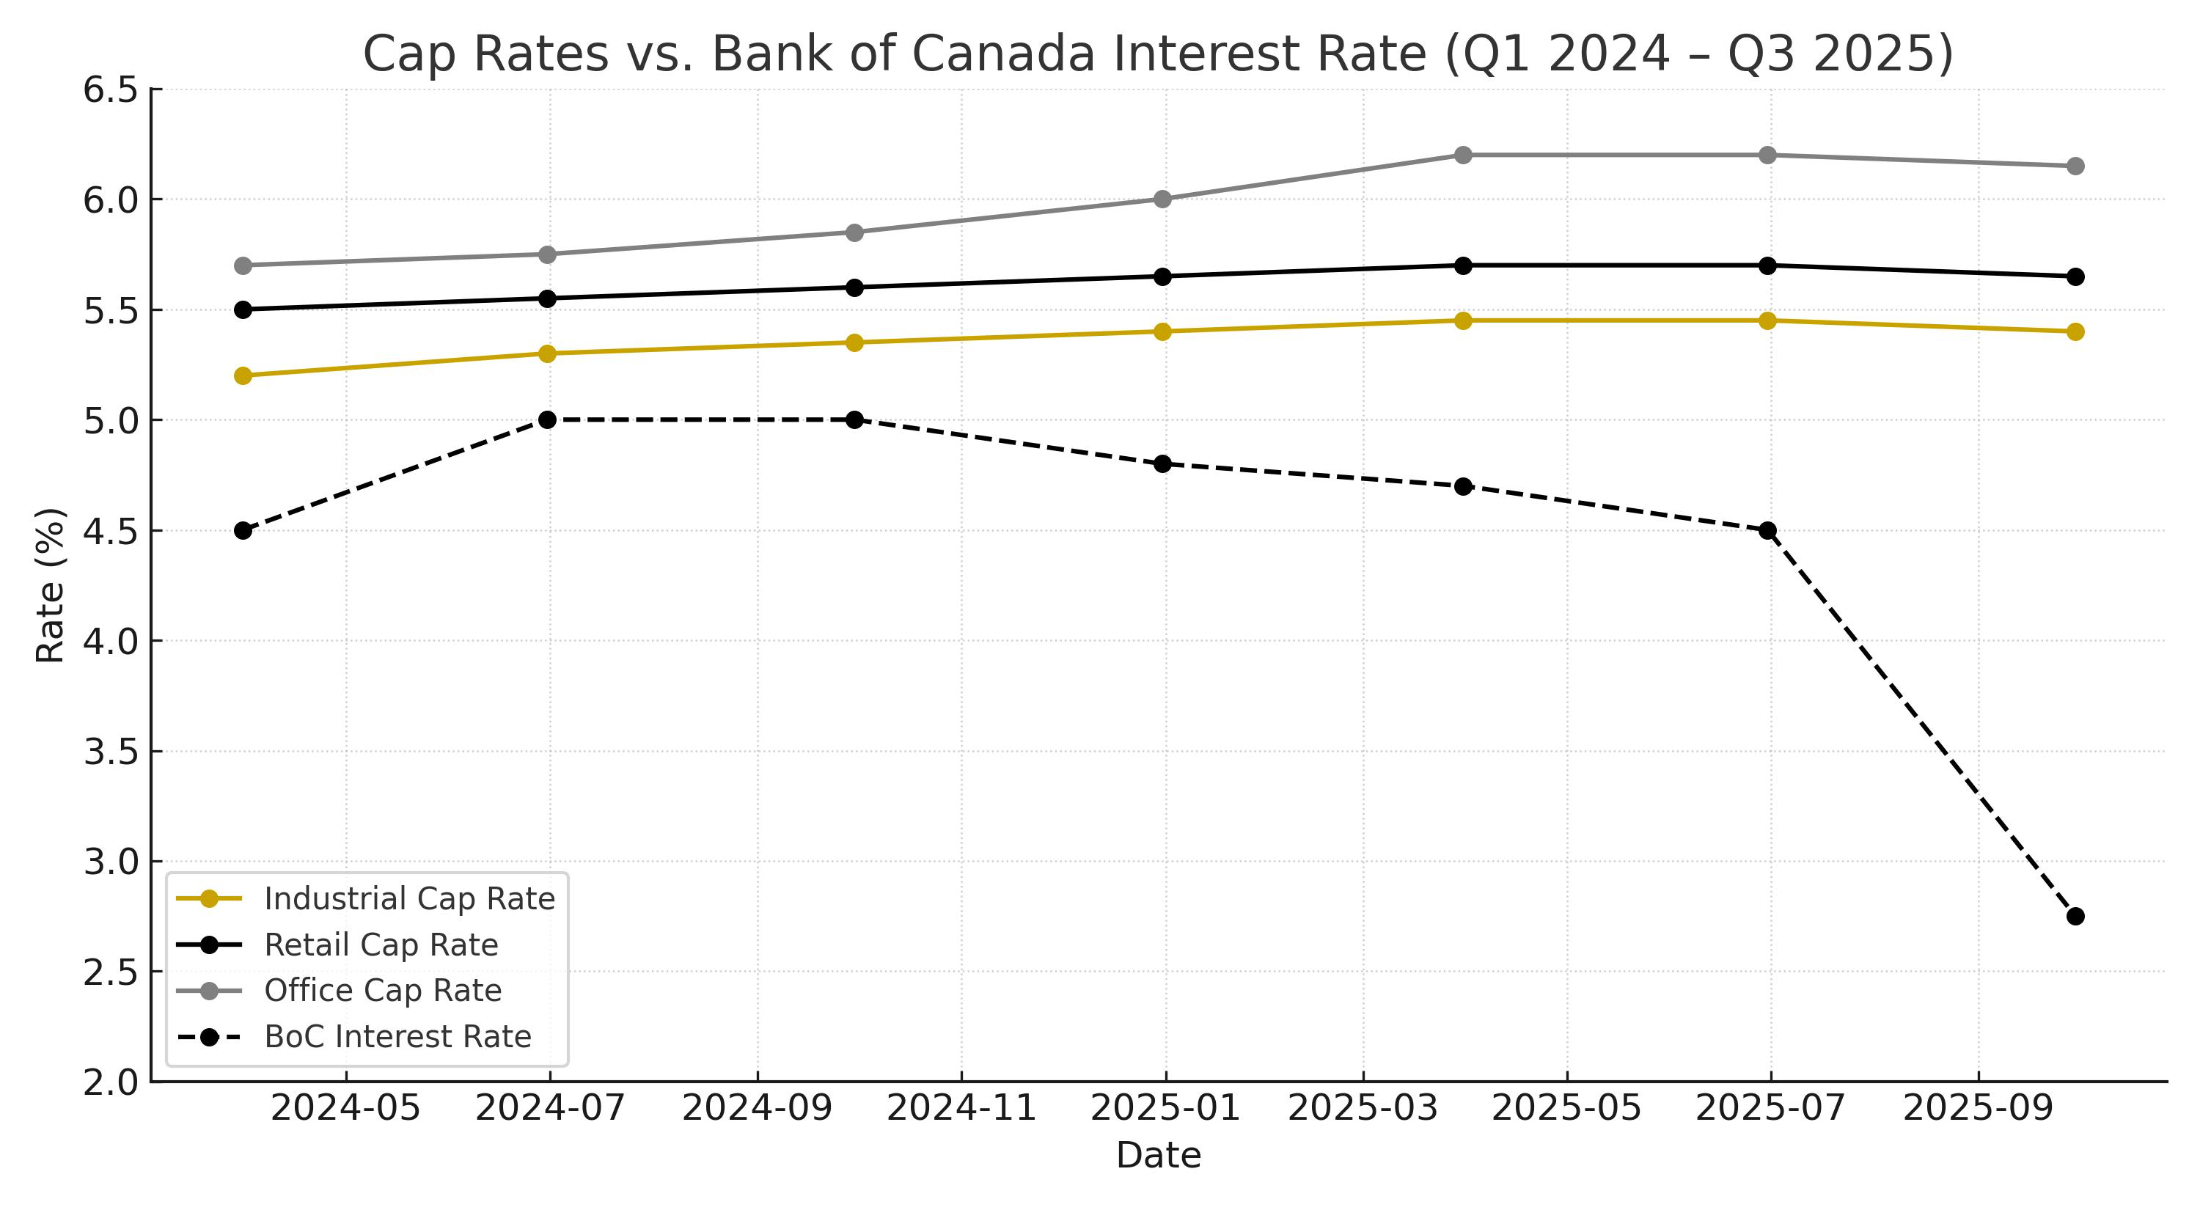
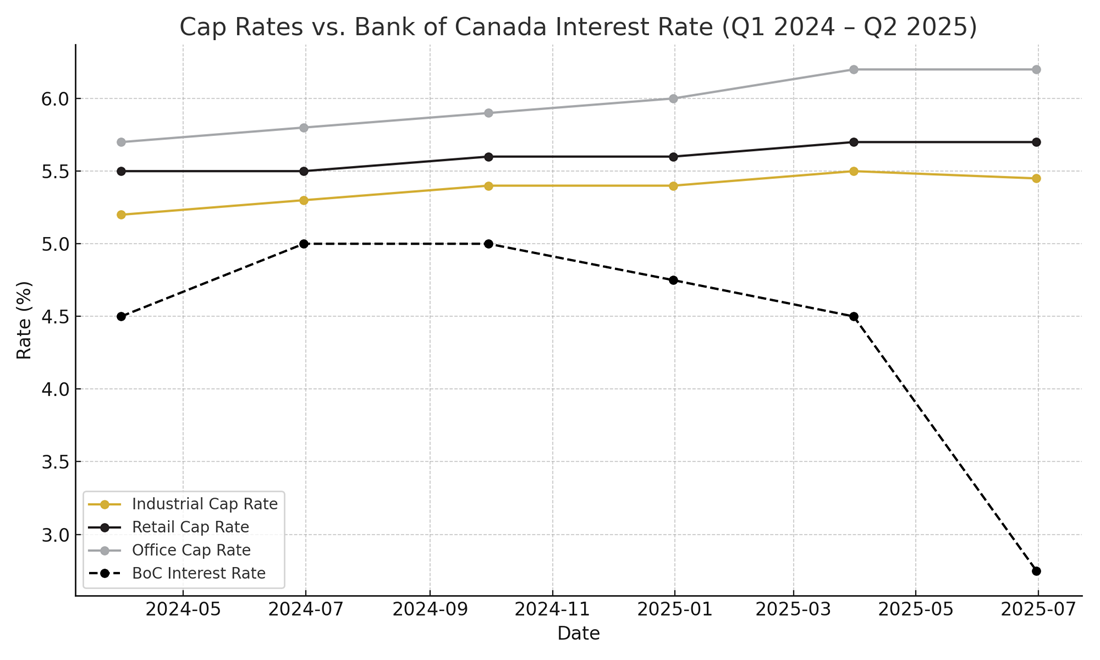
Cap rates remained stable in the mid-5% range, continuing the trend seen through the second half of 2025.
Availability has increased to approximately 6%, creating more options for tenants and slowing rent growth.
Leasing activity remains steady, though at a more normalized pace compared to prior years.
New construction is slowing, which should help stabilize supply levels moving forward.
Investor demand remains strongest for well-located, functional industrial product with long-term leases.
Office
Office cap rates remained largely unchanged, though investor sentiment has improved slightly.
Vacancy levels are still elevated, but early signs of stabilization are emerging in better-quality buildings.
Demand remains focused on smaller units and higher-quality space.
Suburban office continues to outperform downtown markets.
Overall recovery remains uneven, with performance largely dependent on location, building quality, and tenant profile.
Retail
Retail cap rates remained generally stable, with strong demand for grocery-anchored and service-based retail.
Vacancy remains low in key retail nodes, particularly for well-located units.
Secondary retail locations continue to see more leasing pressure and require sharper pricing.
Tenant demand remains active in food, service, and personal care sectors.
Overall, retail continues to be one of the more resilient asset classes, particularly where daily-needs traffic supports tenants.
Buyer and Seller Activity
Investor activity increased modestly through Q1 as confidence continued to return to the market. With borrowing costs stabilizing, more buyers are re-engaging, though underwriting remains cautious.
Private investors and owner-users continue to drive a large portion of activity, particularly in markets like Chilliwack where pricing remains more attractive compared to core Vancouver locations.
Well-leased properties continue to attract the strongest interest and pricing, while assets with vacancy or leasing risk still require flexibility from sellers.
Overall, the gap between buyer and seller expectations has narrowed compared to earlier in the cycle, but the market remains selective.
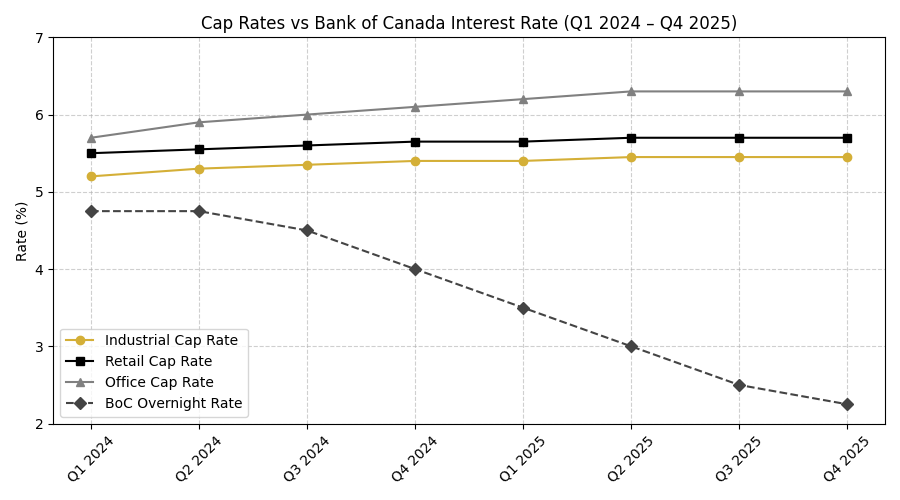
Cap Rates vs. Bond Market
While the Bank of Canada held its policy rate steady through Q1 2026, the bond market showed more movement over the quarter.
The Government of Canada 5-year bond yield moved within a range of approximately 2.7% to 3.2%, while the 10-year bond followed a similar pattern, with modest volatility throughout the quarter.
This is important, as commercial mortgage rates are more closely tied to bond yields than the overnight rate.
As a result:
• Financing costs remained relatively stable overall
• Short-term volatility in bond yields created some caution among investors
• Cap rates have not compressed meaningfully yet, but downward pressure is beginning to build
If bond yields trend downward through 2026, this would likely support gradual cap rate compression, particularly for stronger asset classes.
Conclusion
The Q1 2026 commercial market reflects a more stable and gradually improving environment.
Industrial continues to lead in terms of stability, though supply has shifted conditions slightly in favour of tenants. Retail remains resilient, particularly in necessity-based formats, while office is showing early signs of stabilization but continues to face challenges.
Investor activity is increasing, but remains disciplined, with a clear focus on quality and income stability.
Looking ahead, the direction of bond yields will play a key role in determining how quickly cap rates adjust. For now, the market remains balanced, with cautious optimism heading into the remainder of 2026.
Disclosure
This report is based on information obtained from multiple third-party sources, including Colliers, CBRE, Cushman & Wakefield, Avison Young, and Altus Group. The data presented is intended for informational purposes only and should not be solely relied upon for investment decisions. Cap rates and market conditions may vary based on specific locations, asset conditions, and economic factors. For personalized investment advice, consult with a commercial real estate professional.