
Note: This report focuses on cap rates and market trends for the Greater Vancouver area. The Chilliwack commercial real estate market tends to follow similar trends due to regional economic influences, investor activity, and tenant demand. While specific local variations exist, the insights provided here are generally applicable to Chilliwack as well.
Industrial, Retail, and Office Breakdown
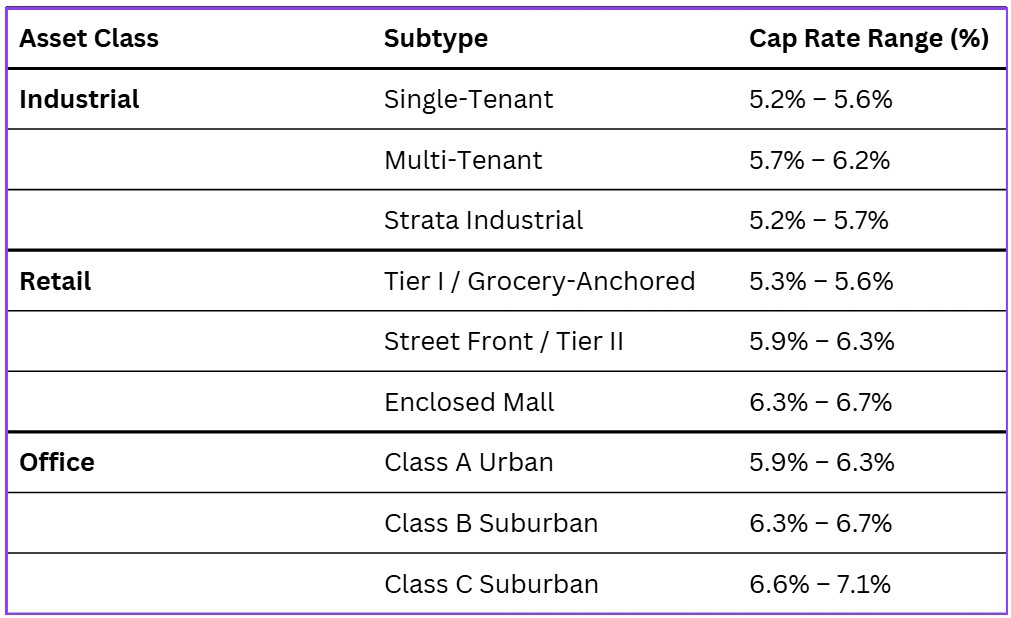
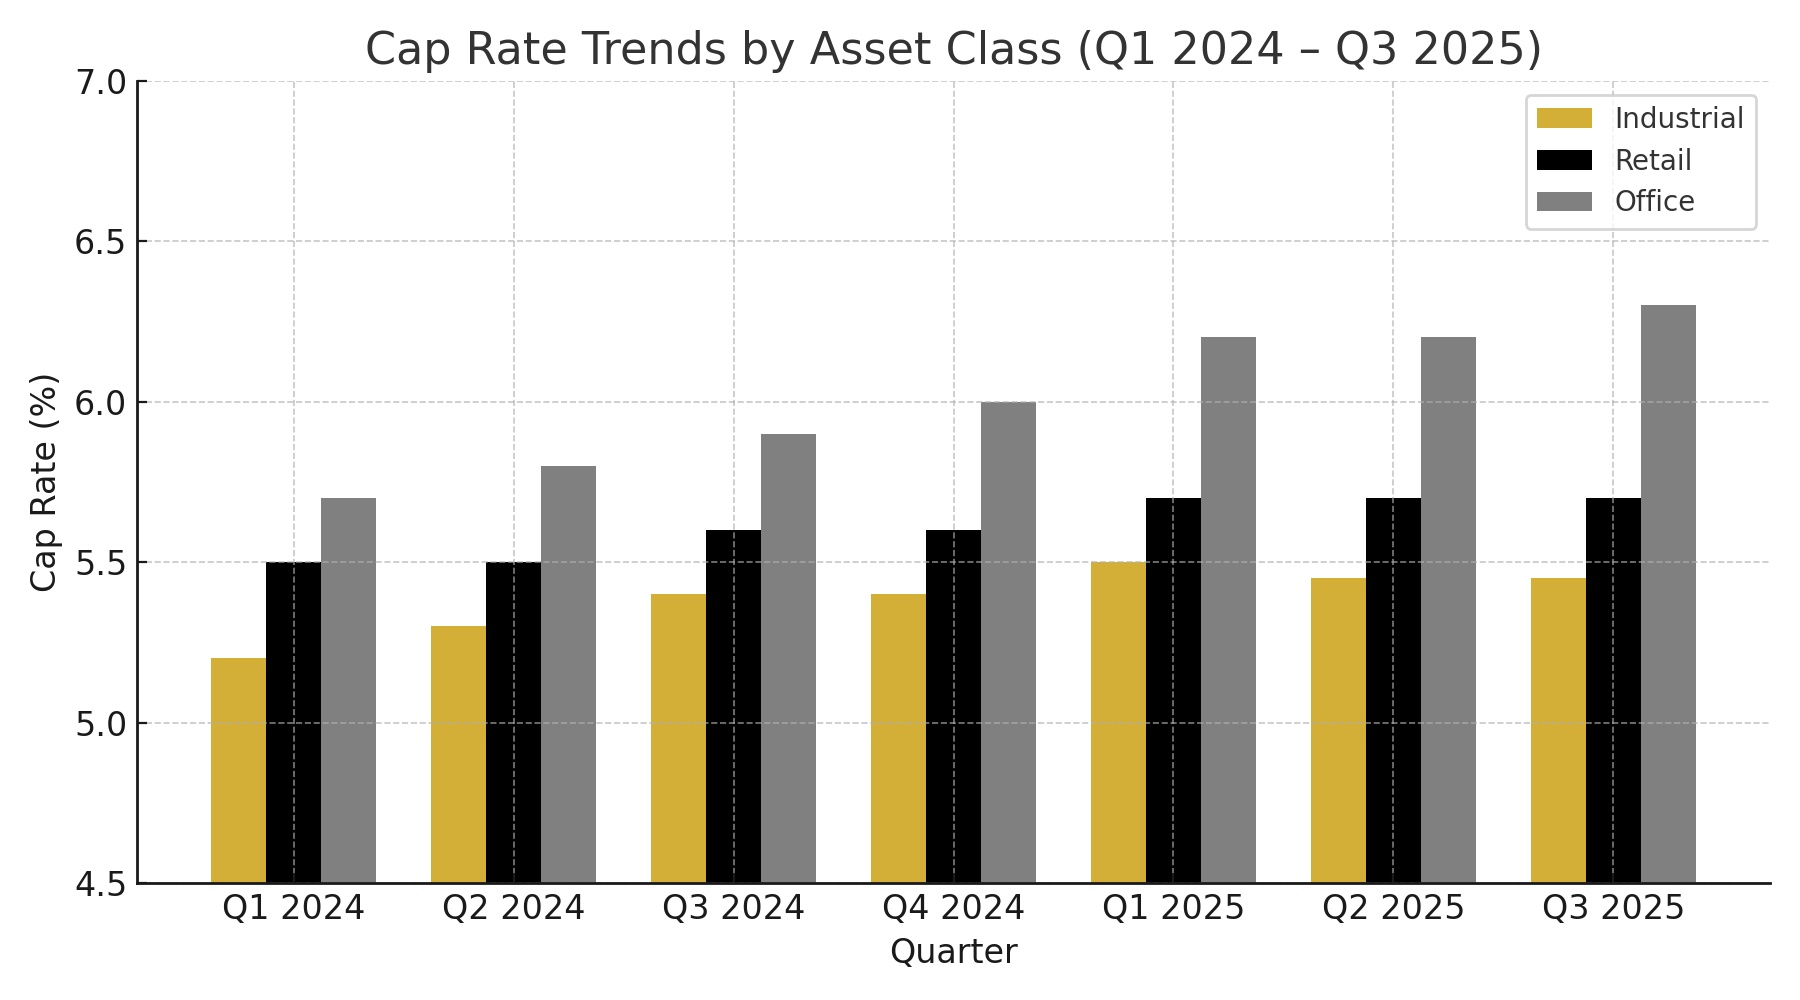
Q3 2025 Cap Rate Trends
Cap rates across all major asset classes held relatively steady this quarter, signaling a market that’s stabilizing after two years of upward movement. Industrial remains the most resilient, retail performance is split between essential and secondary assets, and office continues to face leasing and valuation challenges.
Industrial
Cap rates held steady in the mid-5% range, reflecting the sector’s ongoing stability.
Demand remains strong for single-tenant and strata industrial, especially with long-term leases.
National availability rose to ~6.2%, but investors remain focused on well-located, essential assets.
Some premium assets saw minor cap rate compression due to competitive buyer interest.
Retail
Grocery-anchored retail held firm in the mid-5% range, backed by essential retail demand.
Secondary retail softened, with cap rates rising to the high-5% to mid-6% range.
Vacancy and tenant turnover increased, prompting landlords to offer aggressive leasing incentives.
The sector is split: strong performance in Tier I; pressure on yields in Tier II locations.
Office
Office cap rates remain highest among asset classes, averaging mid-6% to 7% in suburban areas.
Even Class A offices are trading at higher yields; downtown AA assets reached ~6.8%.
Flight-to-quality persists as tenants favor modern, efficient spaces over older inventory.
Valuations are under pressure, and office recovery is expected to trail other sectors.
Buyer and Seller Activity
Investor activity in Q3 2025 reflected cautious optimism. Private buyers and owner-users drove most acquisitions, especially in secondary markets like Chilliwack where yields are more attractive and financing conditions have modestly improved. Industrial strata units and grocery-anchored retail remained top targets for these groups. Institutional investors, meanwhile, stayed selective — focusing on stabilized, income-producing assets — and continued listing non-core properties, particularly in the office and secondary retail segments.
On the sell side, pricing expectations have started to shift. Owners of well-leased, high-quality assets generally held firm, expecting conditions to improve in the coming quarters. In contrast, sellers of challenged properties, like partially vacant offices, have shown increased flexibility, with some accepting modest discounts to close deals. While activity remains measured overall, both buyers and sellers are re-engaging as interest rate trends improve and market confidence slowly returns.
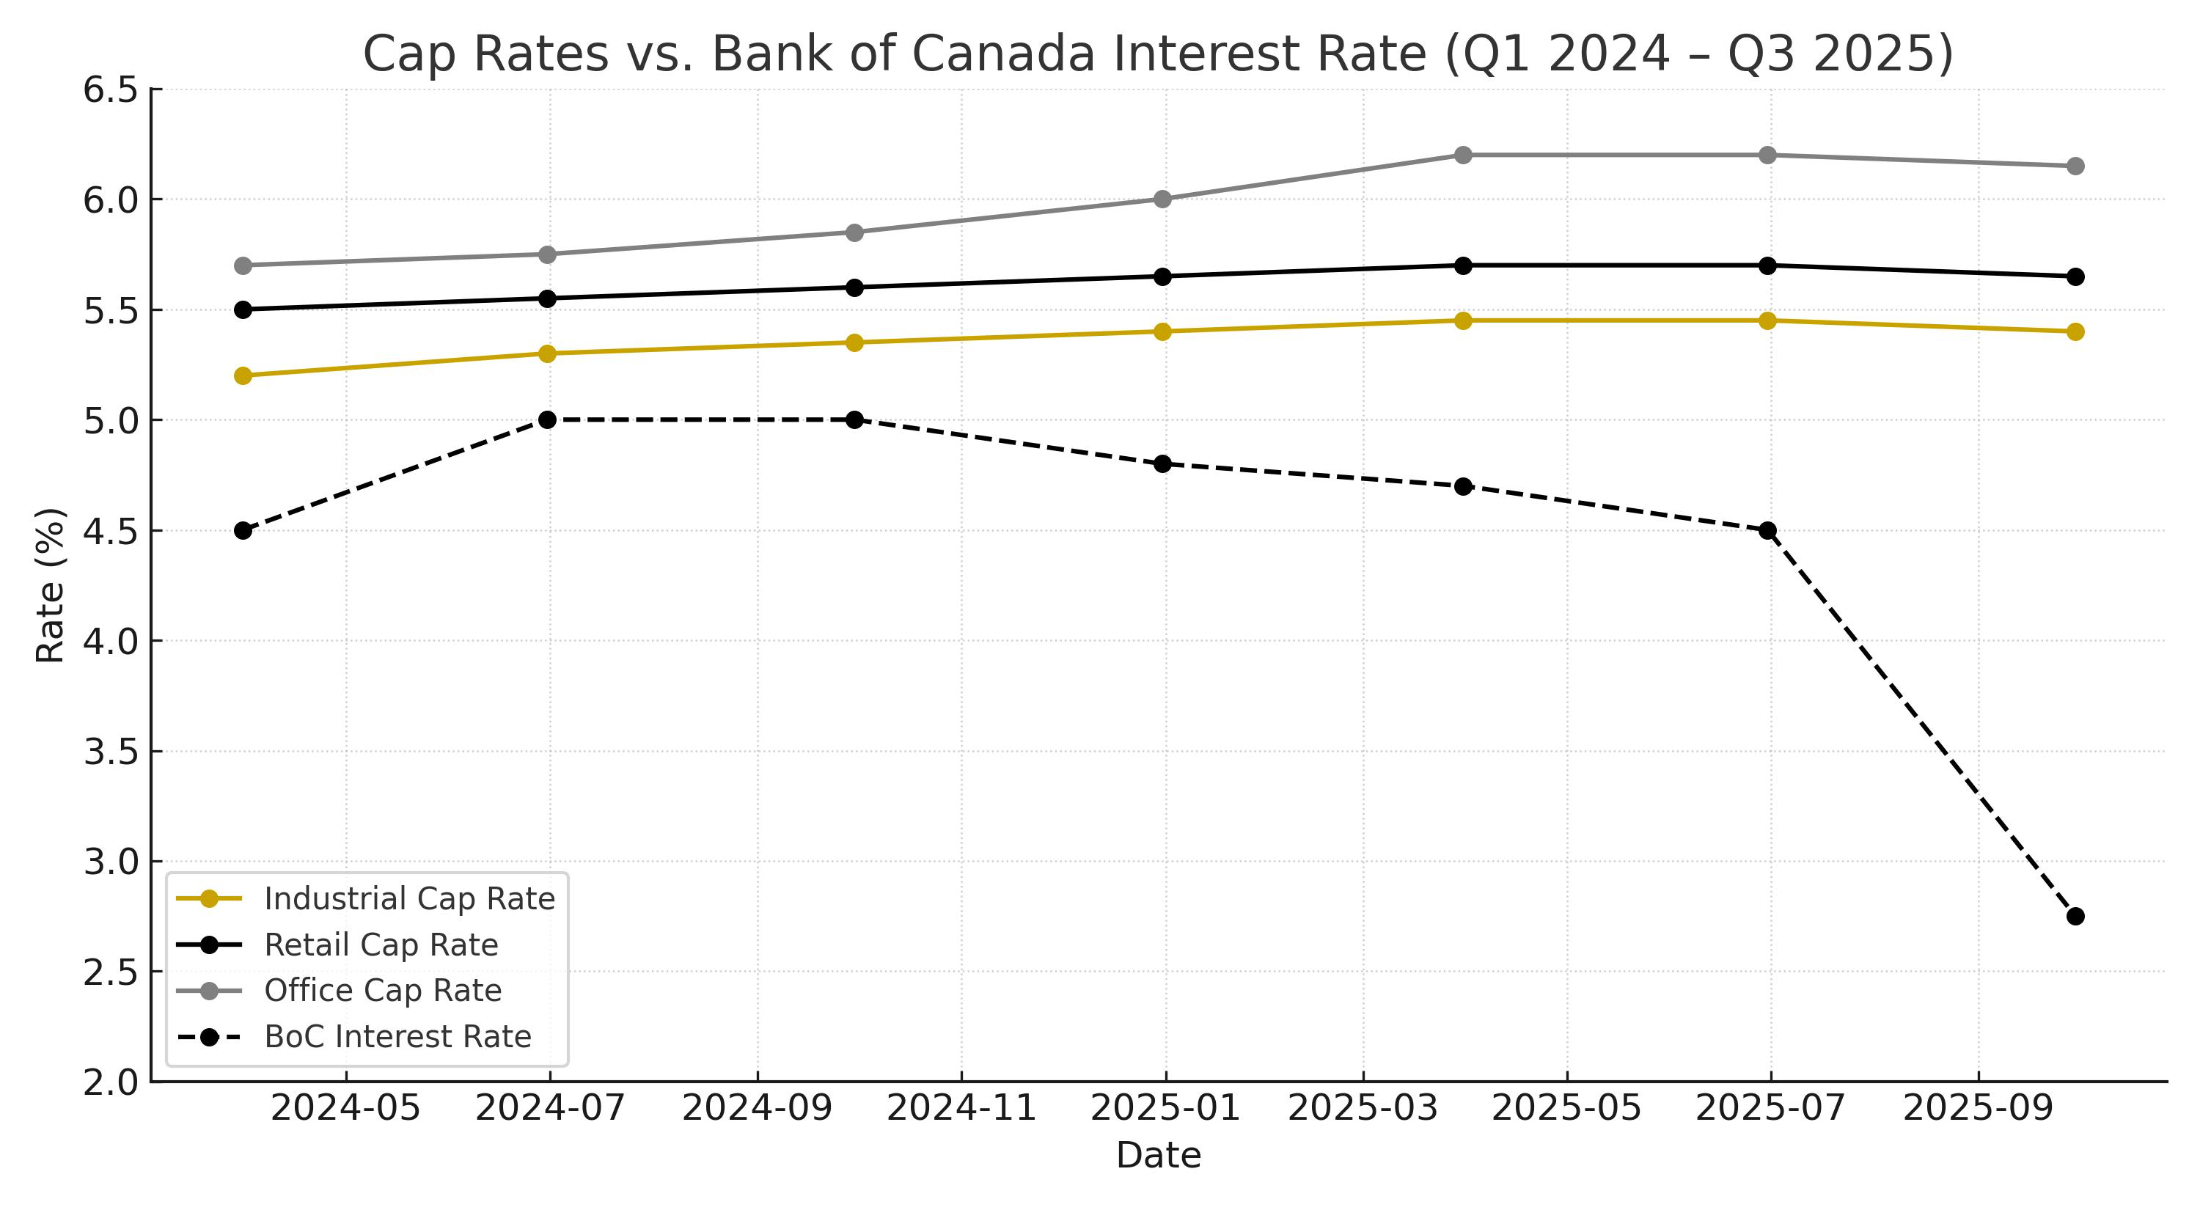
Cap Rates vs. Bank of Canada Interest Rates
In Q3 2025, the Bank of Canada lowered its overnight rate to 2.50%—its eighth cut since June 2024—amid softening inflation and rising unemployment, easing borrowing conditions. The 10-year bond yield followed suit, falling to around 3.2% by quarter-end. Despite this, cap rates across most asset classes held steady, suggesting the market has adjusted to higher financing costs. Pricing is now driven more by asset fundamentals than rate shifts, and while further easing could lead to modest cap rate compression in 2026, the current tone remains stable and cautious.
Conclusion
The Q3 2025 cap rate outlook points to a market in transition, with rates stabilizing after two years of increases. Investors continue to favor resilient assets like industrial and grocery-anchored retail, while office remains under pressure. As borrowing costs ease and confidence slowly returns, the groundwork is being laid for a selective recovery—driven by private capital and focused on well-located, income-secure properties.
Disclosure
This report is based on information obtained from multiple third-party sources, including Colliers, CBRE, Cushman & Wakefield, Avison Young, and Altus Group. The data presented is intended for informational purposes only and should not be solely relied upon for investment decisions. Cap rates and market conditions may vary based on specific locations, asset conditions, and economic factors. For personalized investment advice, consult with a commercial real estate professional.